A laptop on battery, with single-channel memory or dropping clocks because of heat, shouldn’t get the same preset as a plugged-in desktop. The first step is to measure the context and find what’s actually limiting the session.
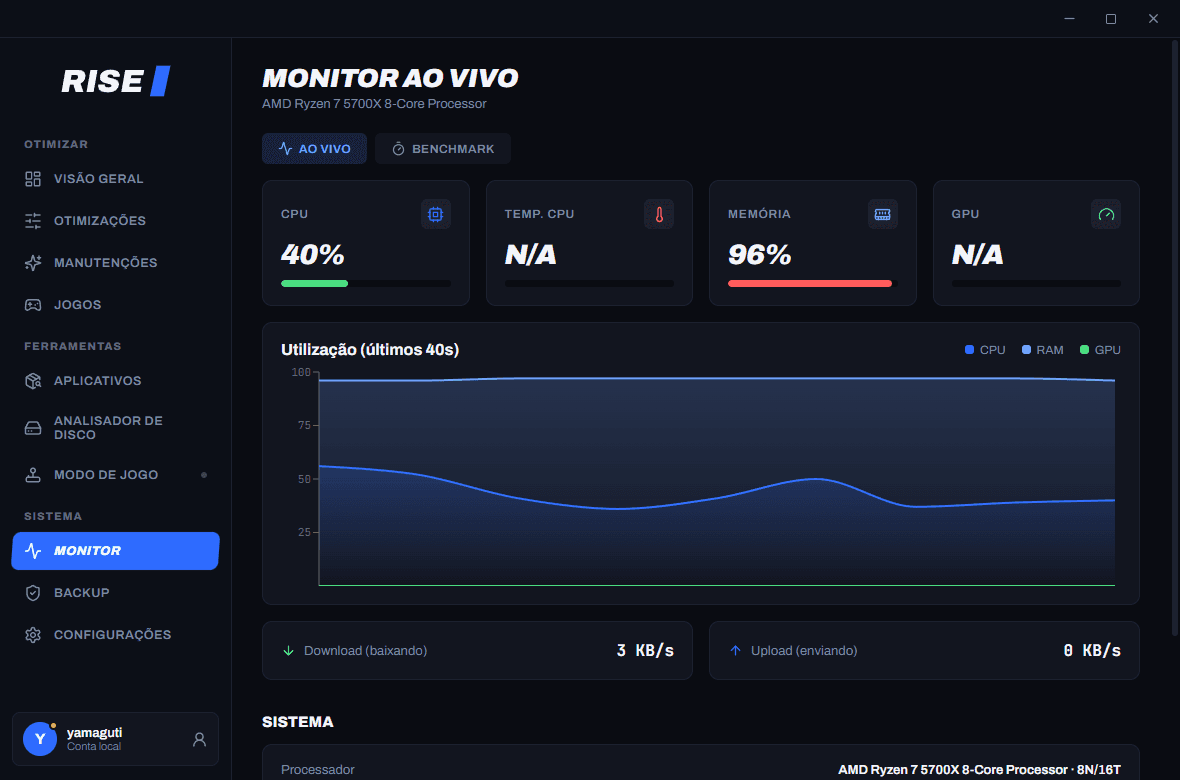
A CPU limit shows up in games as high usage on one or more threads, a GPU that isn’t saturated and frametime that depends on the simulation. A GPU limit shows the card running close to its ceiling, with resolution changes moving the FPS. Throttling means watching clocks and temperature across the session, not just a single reading.
XMP and EXPO are memory profiles; ReBAR and Smart Access Memory depend on the platform, firmware, driver and game. An old driver can carry a known regression, but updating a driver can also change stability. That’s why Rise identifies the state, points you to the official source and measures before and after.
Diagnostics shouldn’t turn “might help” into “will gain”. When the fix is manual (BIOS, a second RAM stick, thermal cleaning or a driver), the app should guide you and make it clear it didn’t make the change itself.